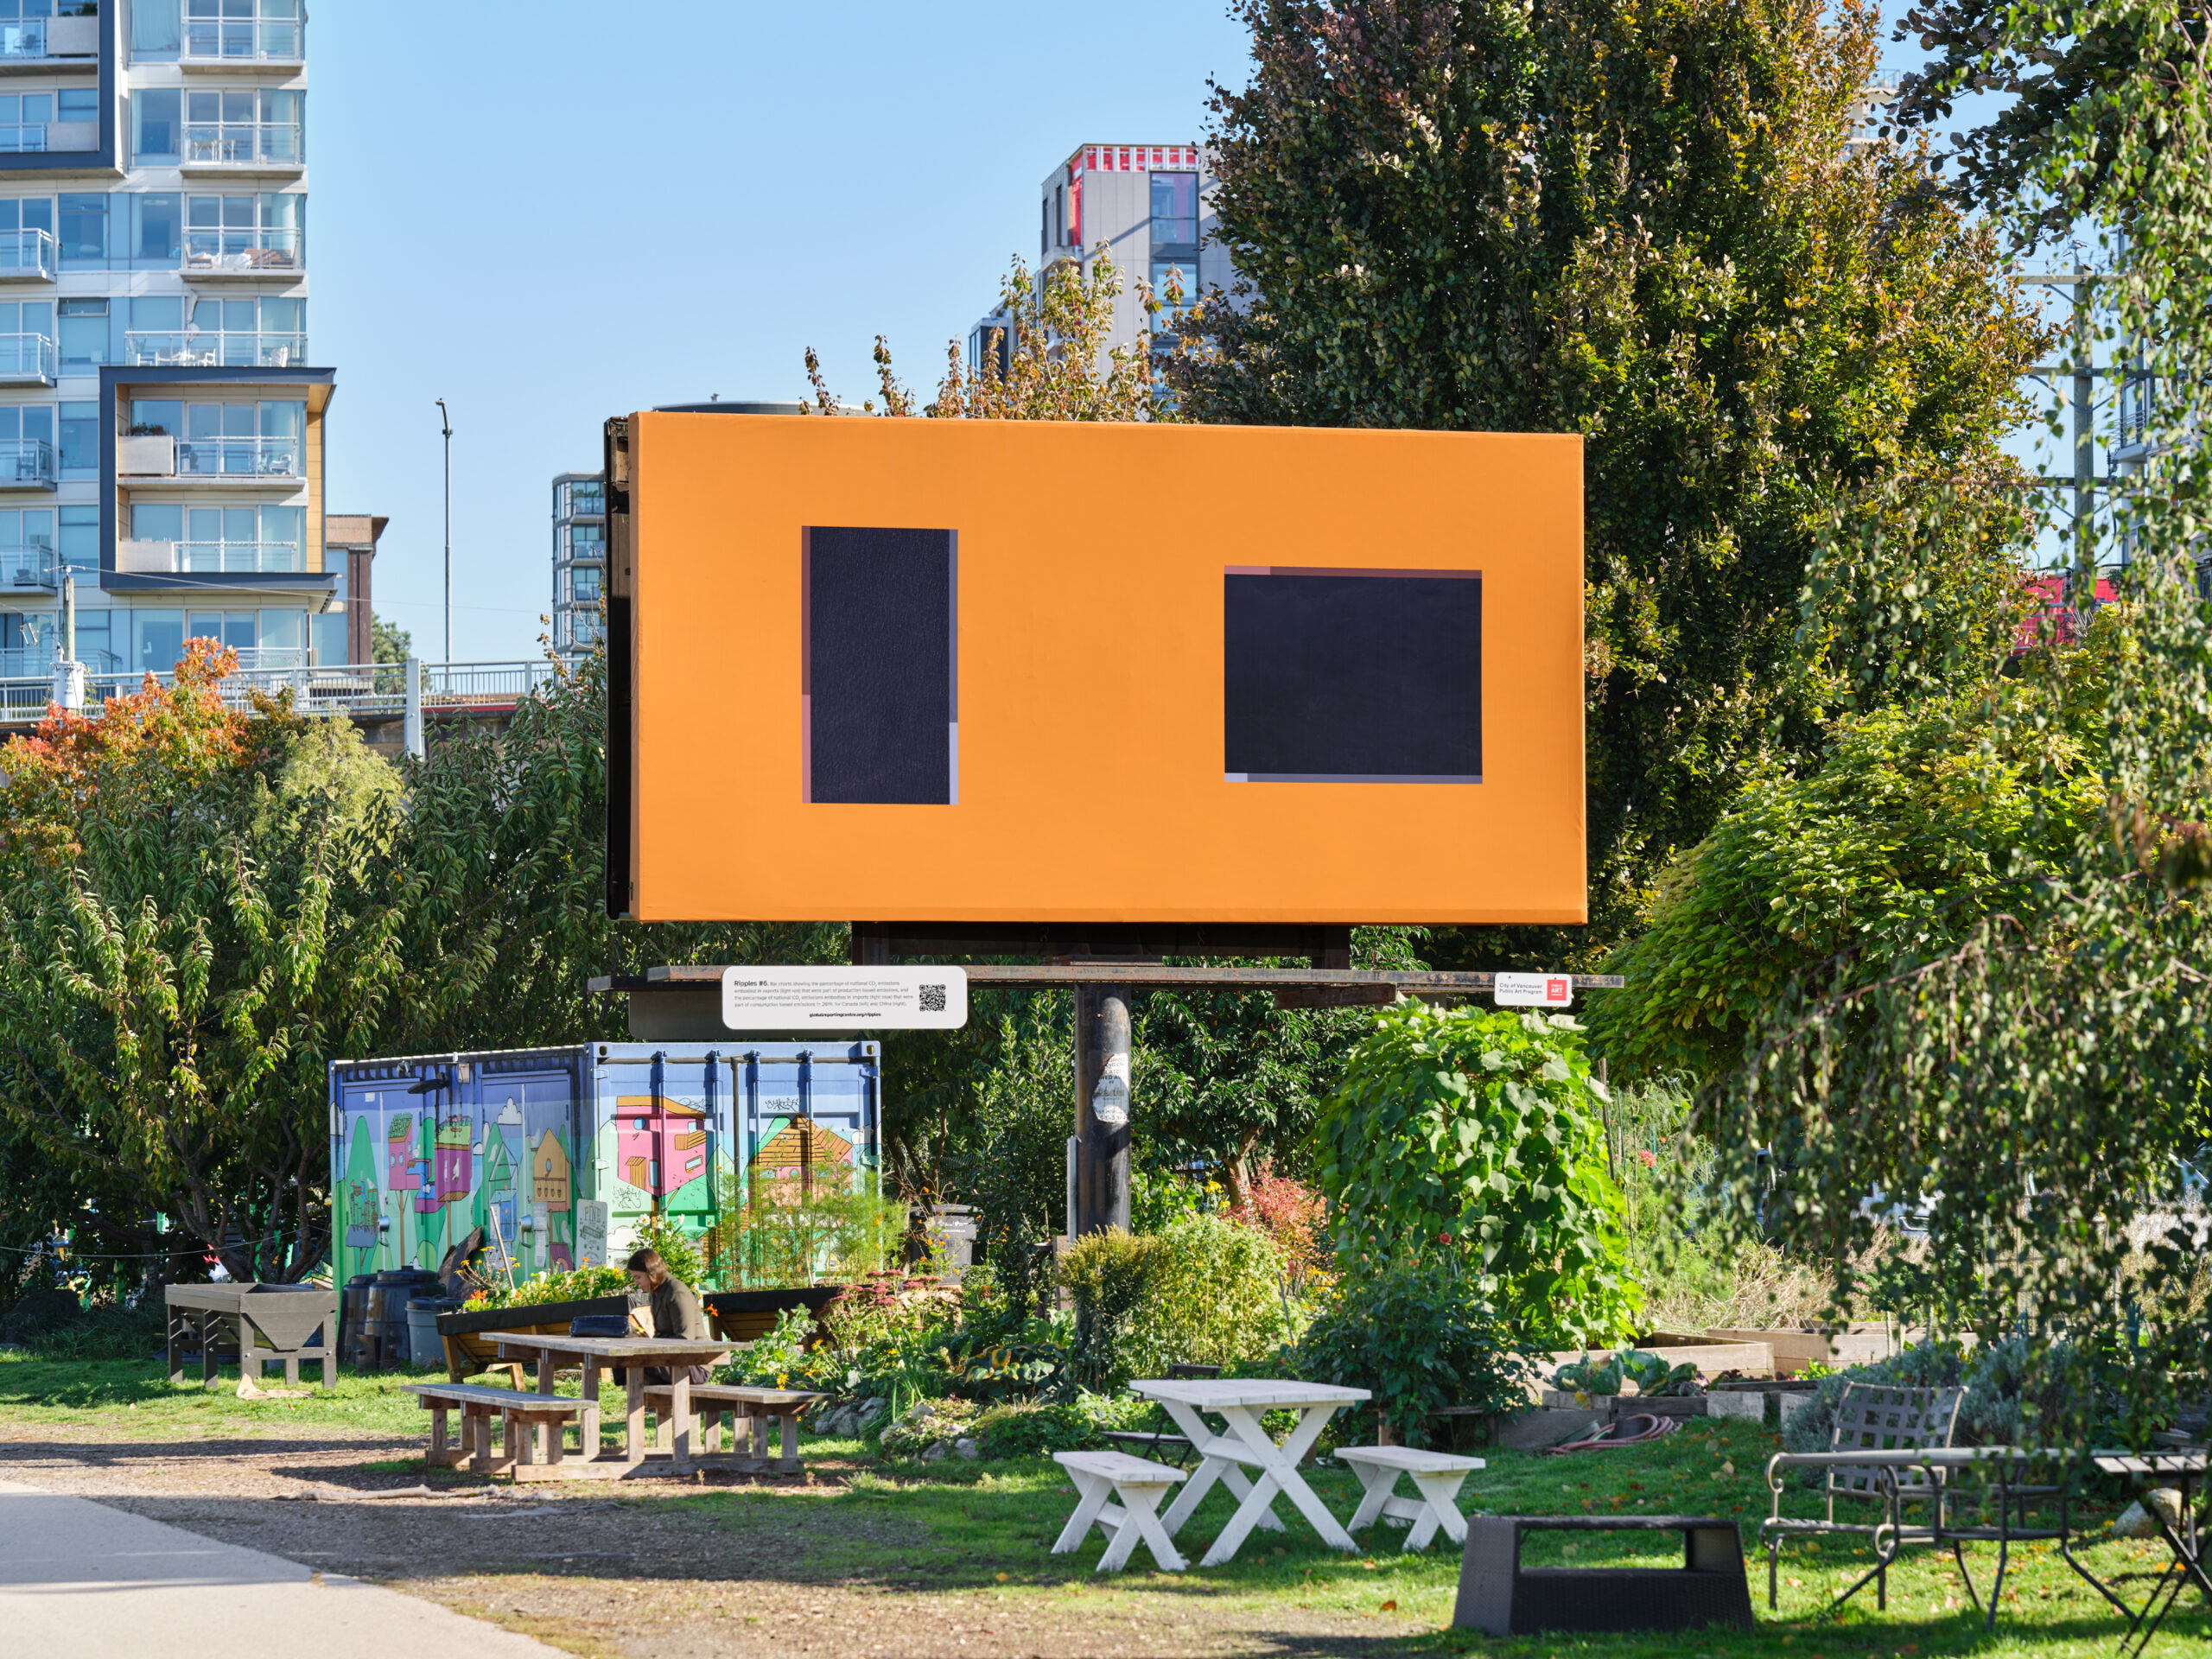
Ripples #6. Bar charts showing the percentage of national CO2 emissions embodied in exports (light red) that were part of production-based emissions, and the percentage of national CO2 emissions embodied in imports (light blue) that were part of consumption-based emissions in 2019, for Canada (left) and China (right). Source: Global Efficiency Intelligence, Embodied Carbon in Trade: Carbon Loophole report. Satellite imagery of the Salish Sea (2024) adapted from Planet Labs PBC. (Photo: Dennis Ha)
Image produced for the Ripples series and public art project