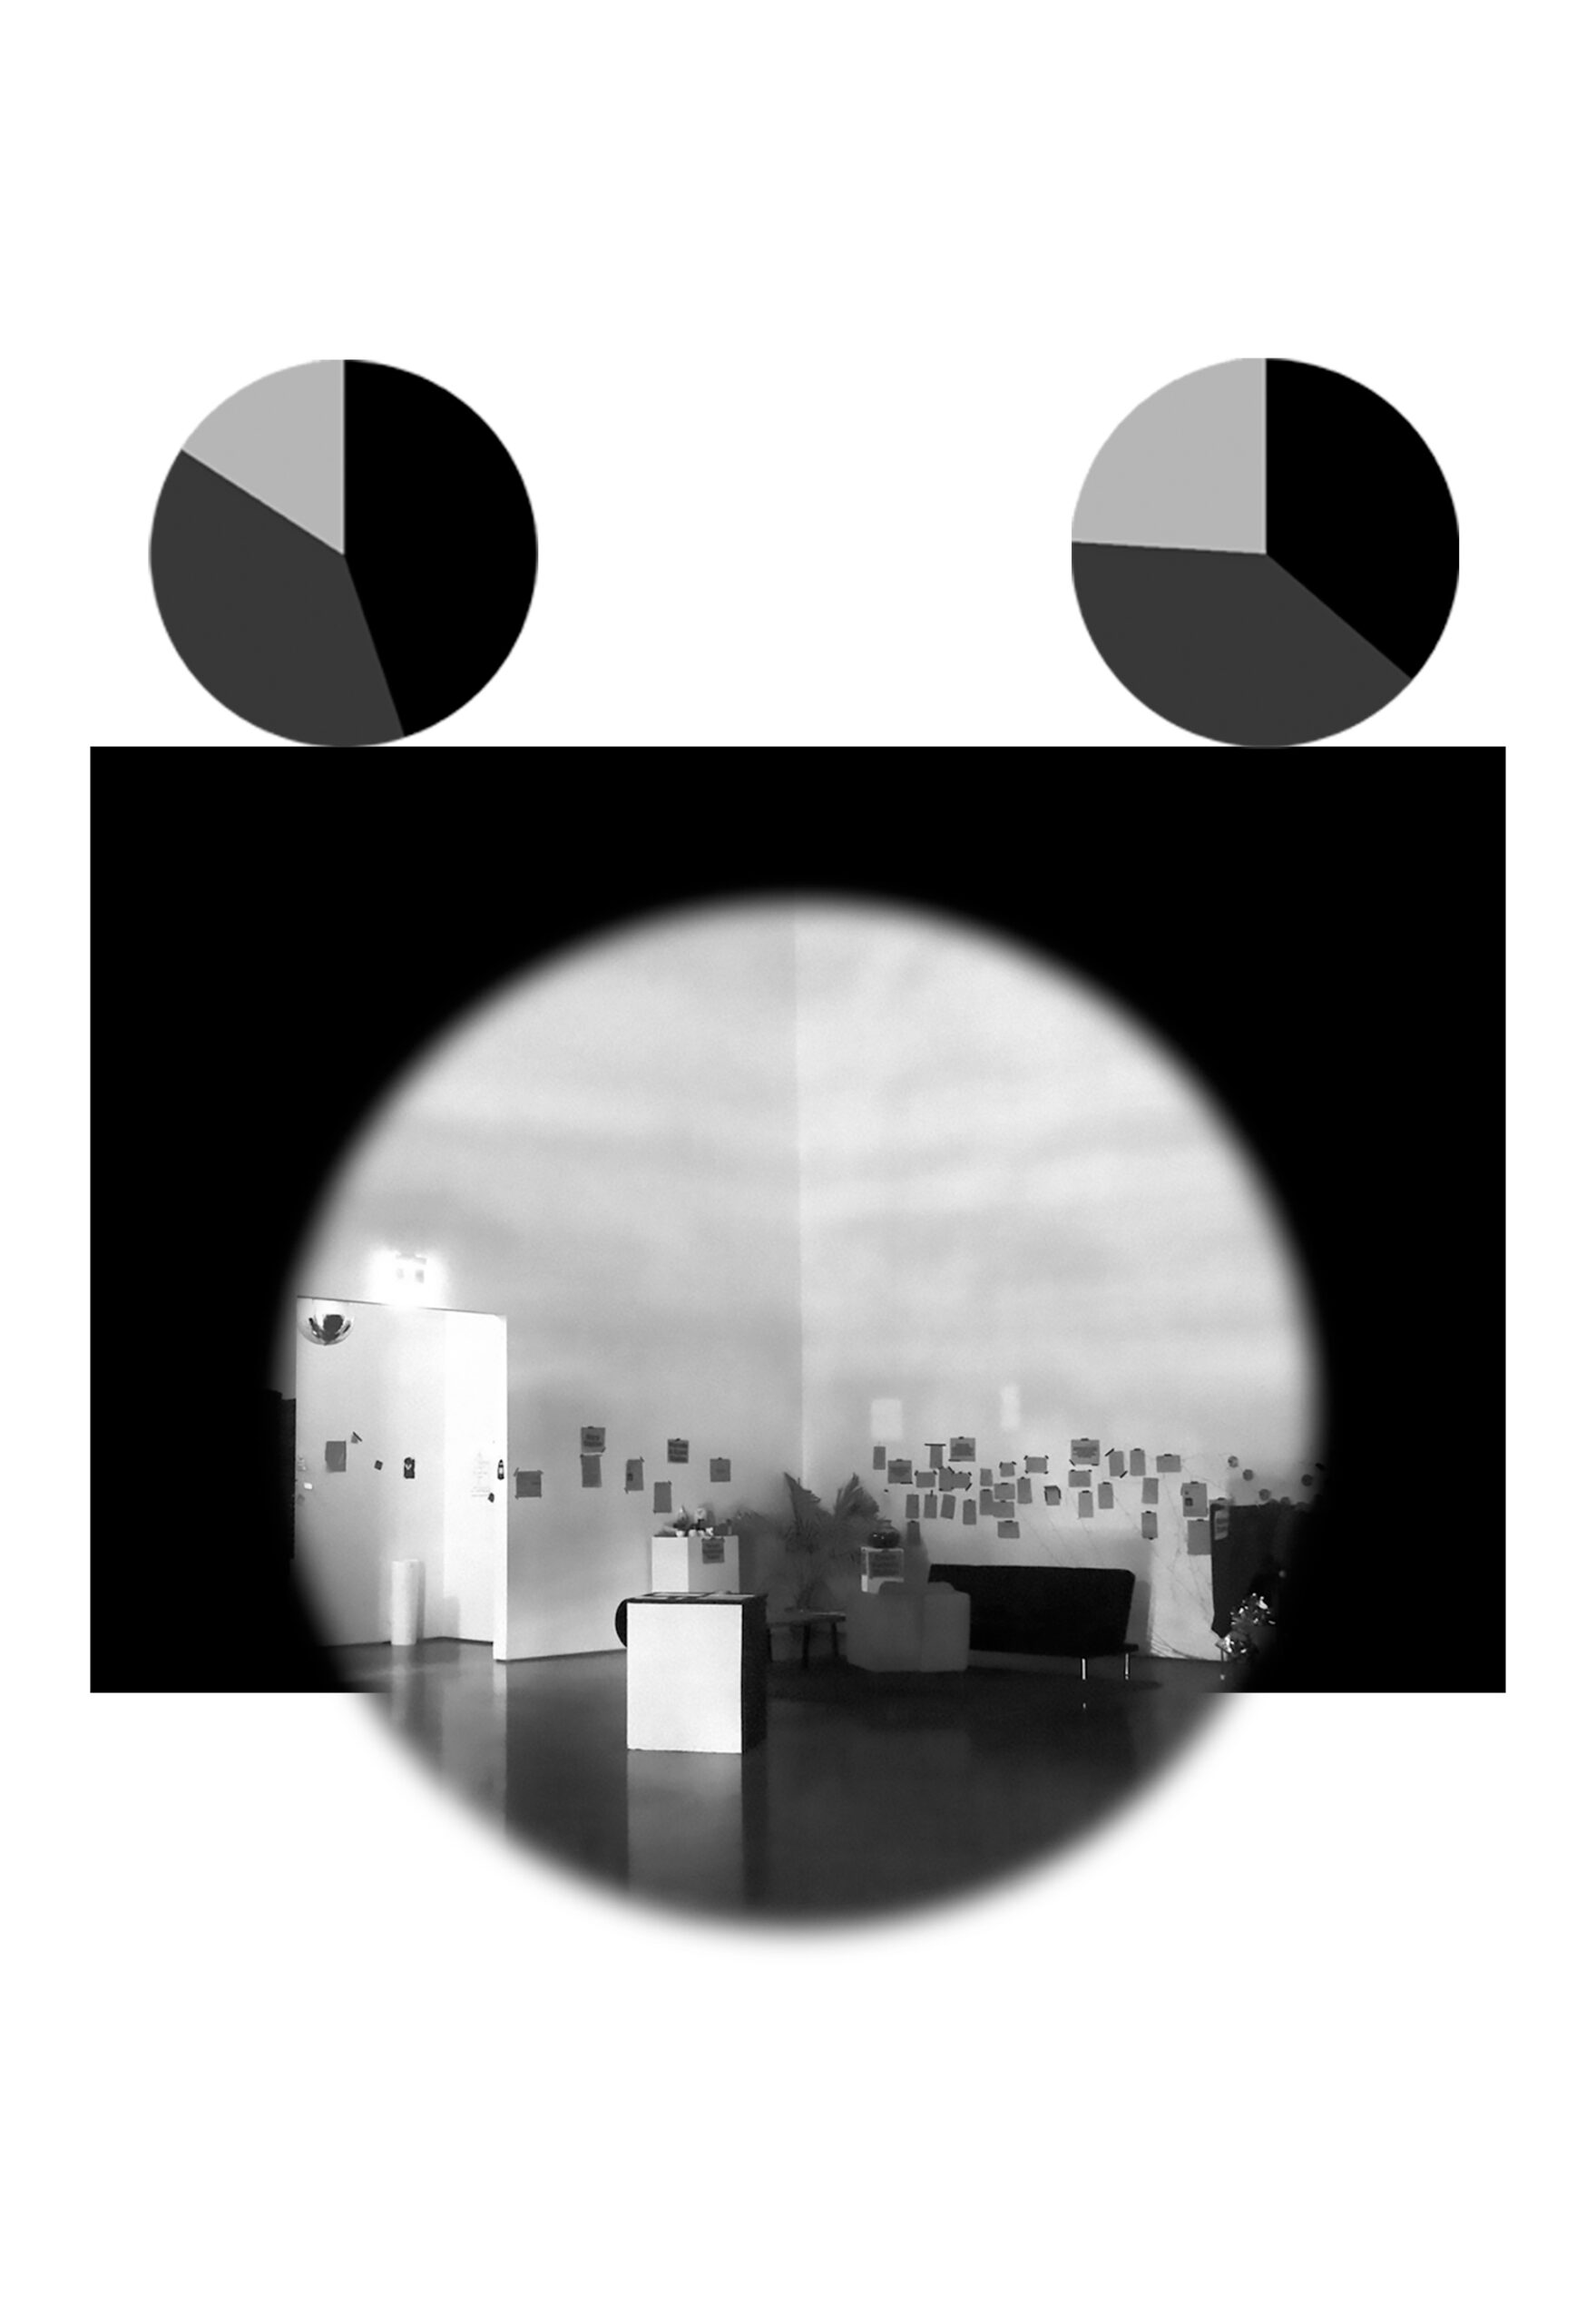
Gallery View 1. Pie charts of highest revenue sources for Canadian universities in both 2000/2001 (left) and 2019/2020 (right): government revenues (black), private revenues (dark grey), and student fees (light grey). Adapted from Financial Information of Universities and Colleges Survey / Statistics Canada.
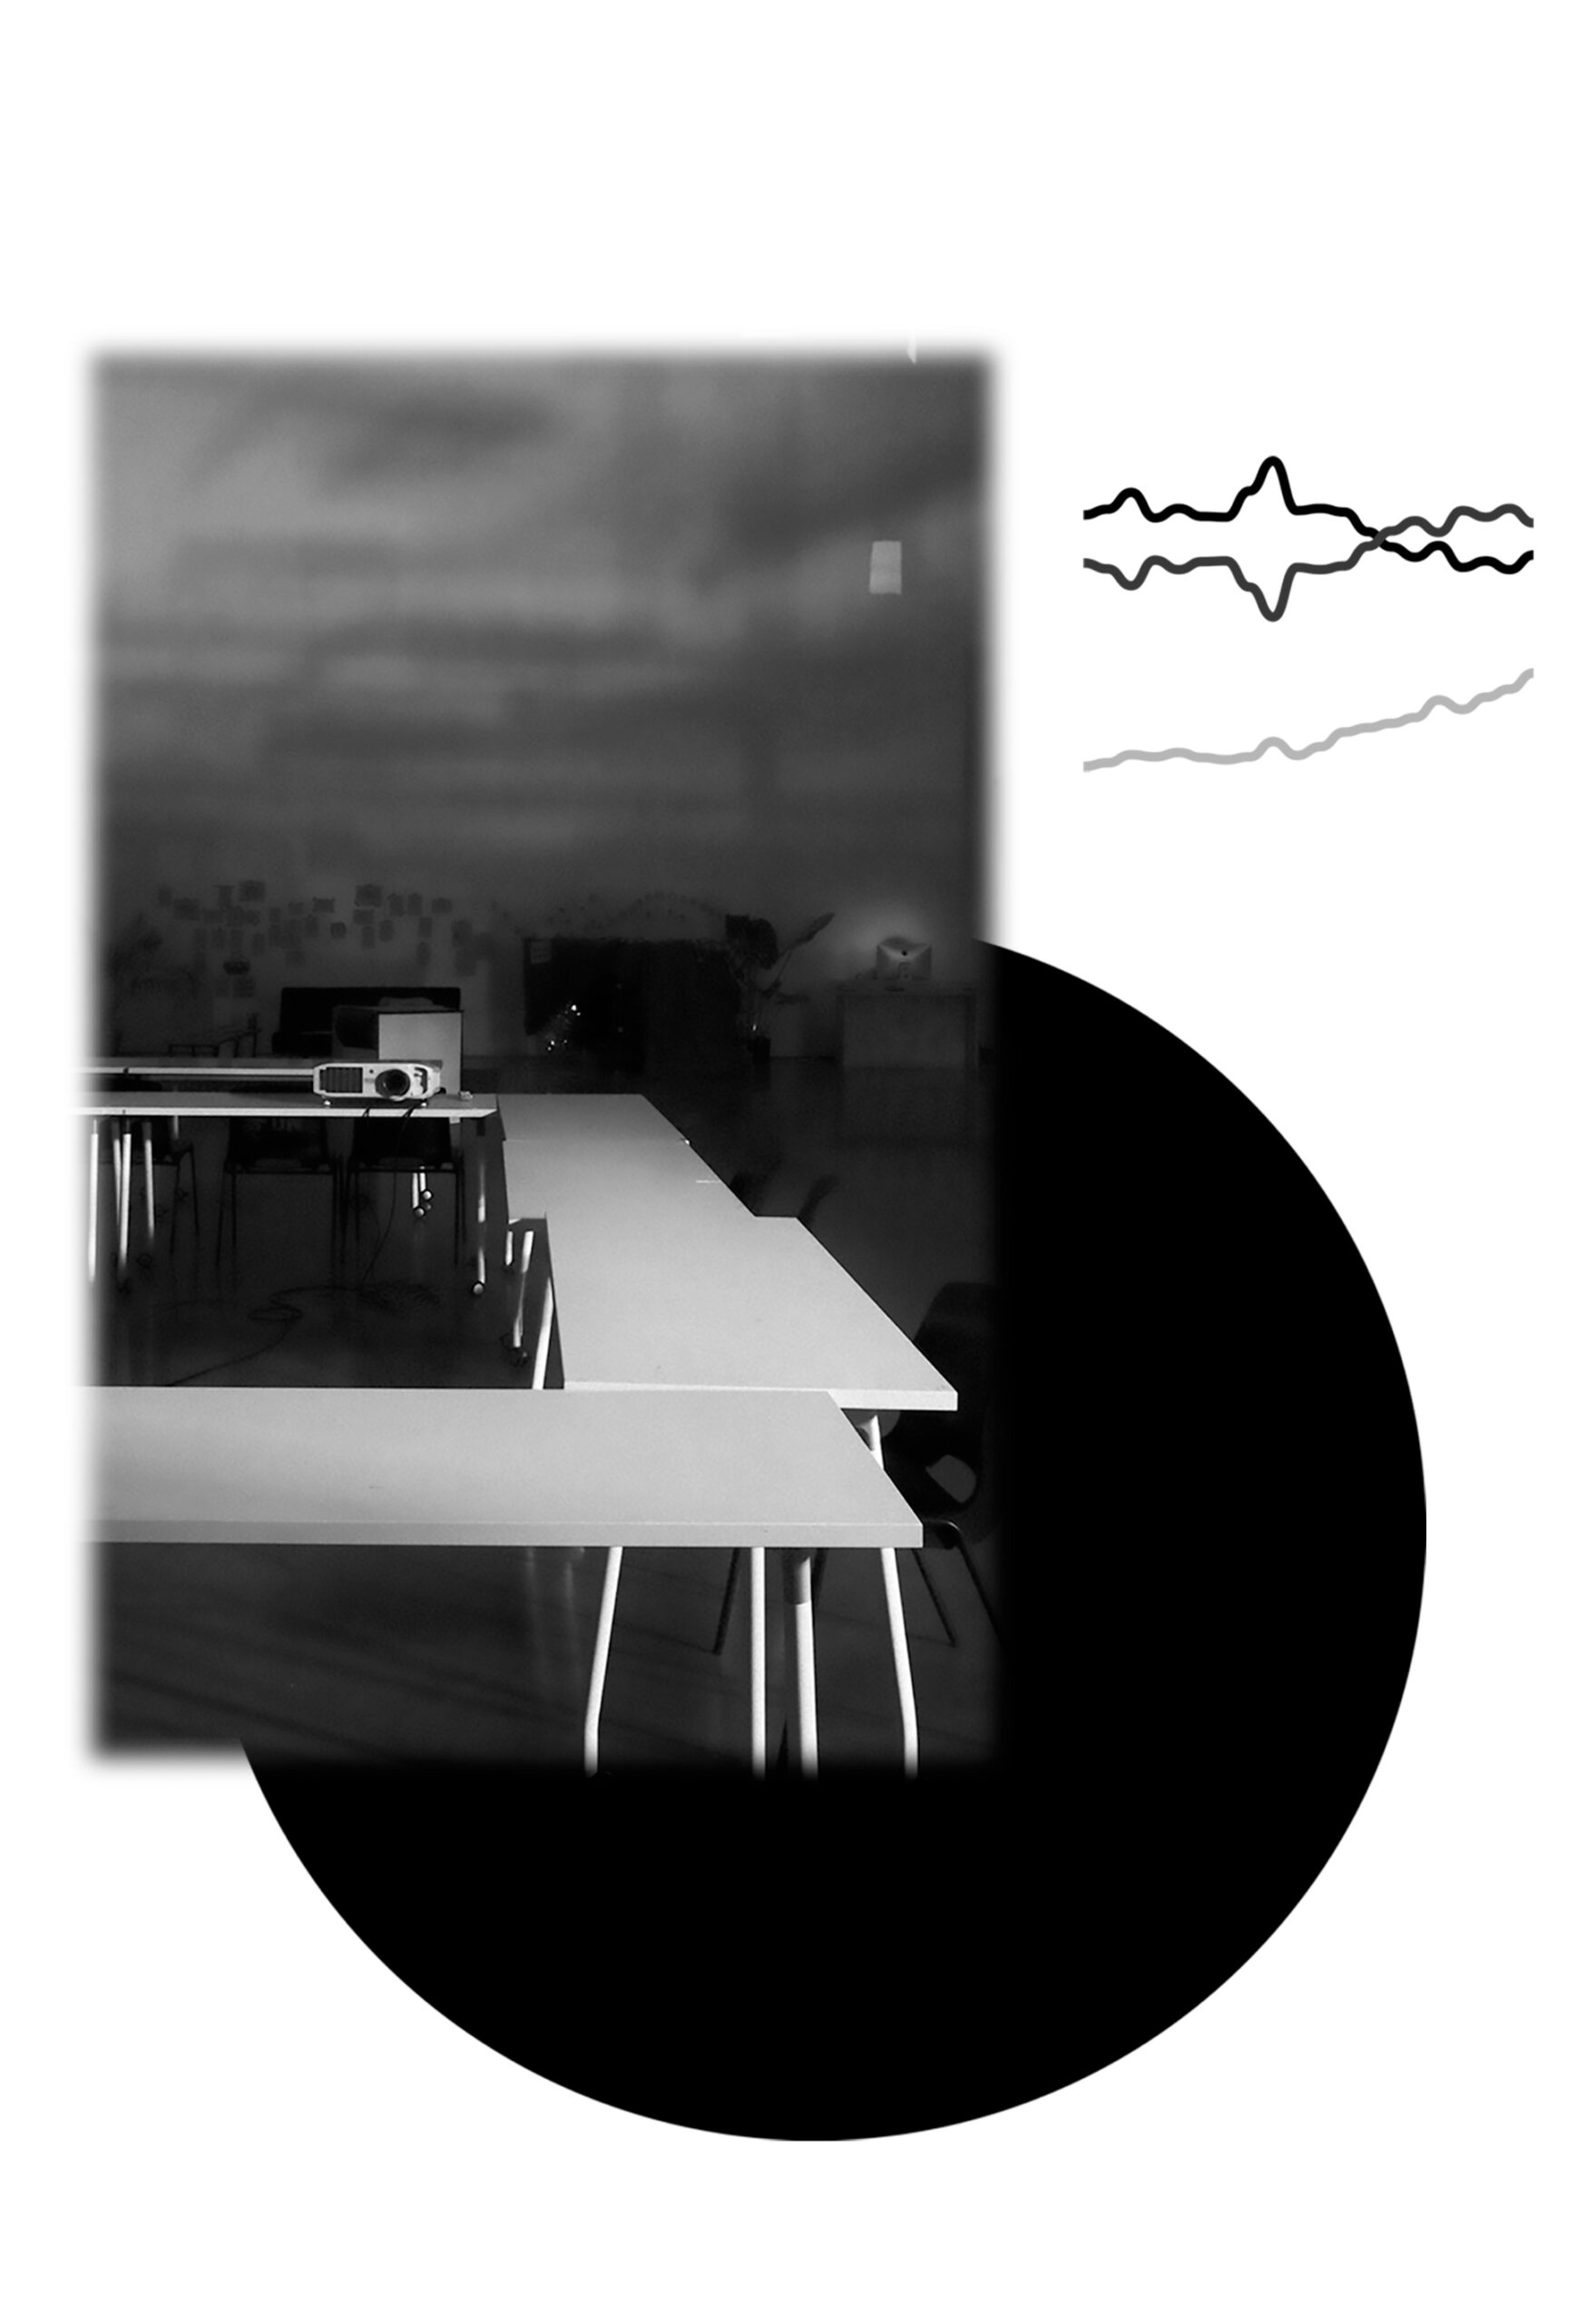
Gallery View 2. Line chart of highest revenue sources for Canadian universities, as percentage of total revenue, from 2000/2001 to 2019/2020: government revenues (black), private revenues (dark grey), and student fees (light grey). Adapted from Financial Information of Universities and Colleges Survey / Statistics Canada.
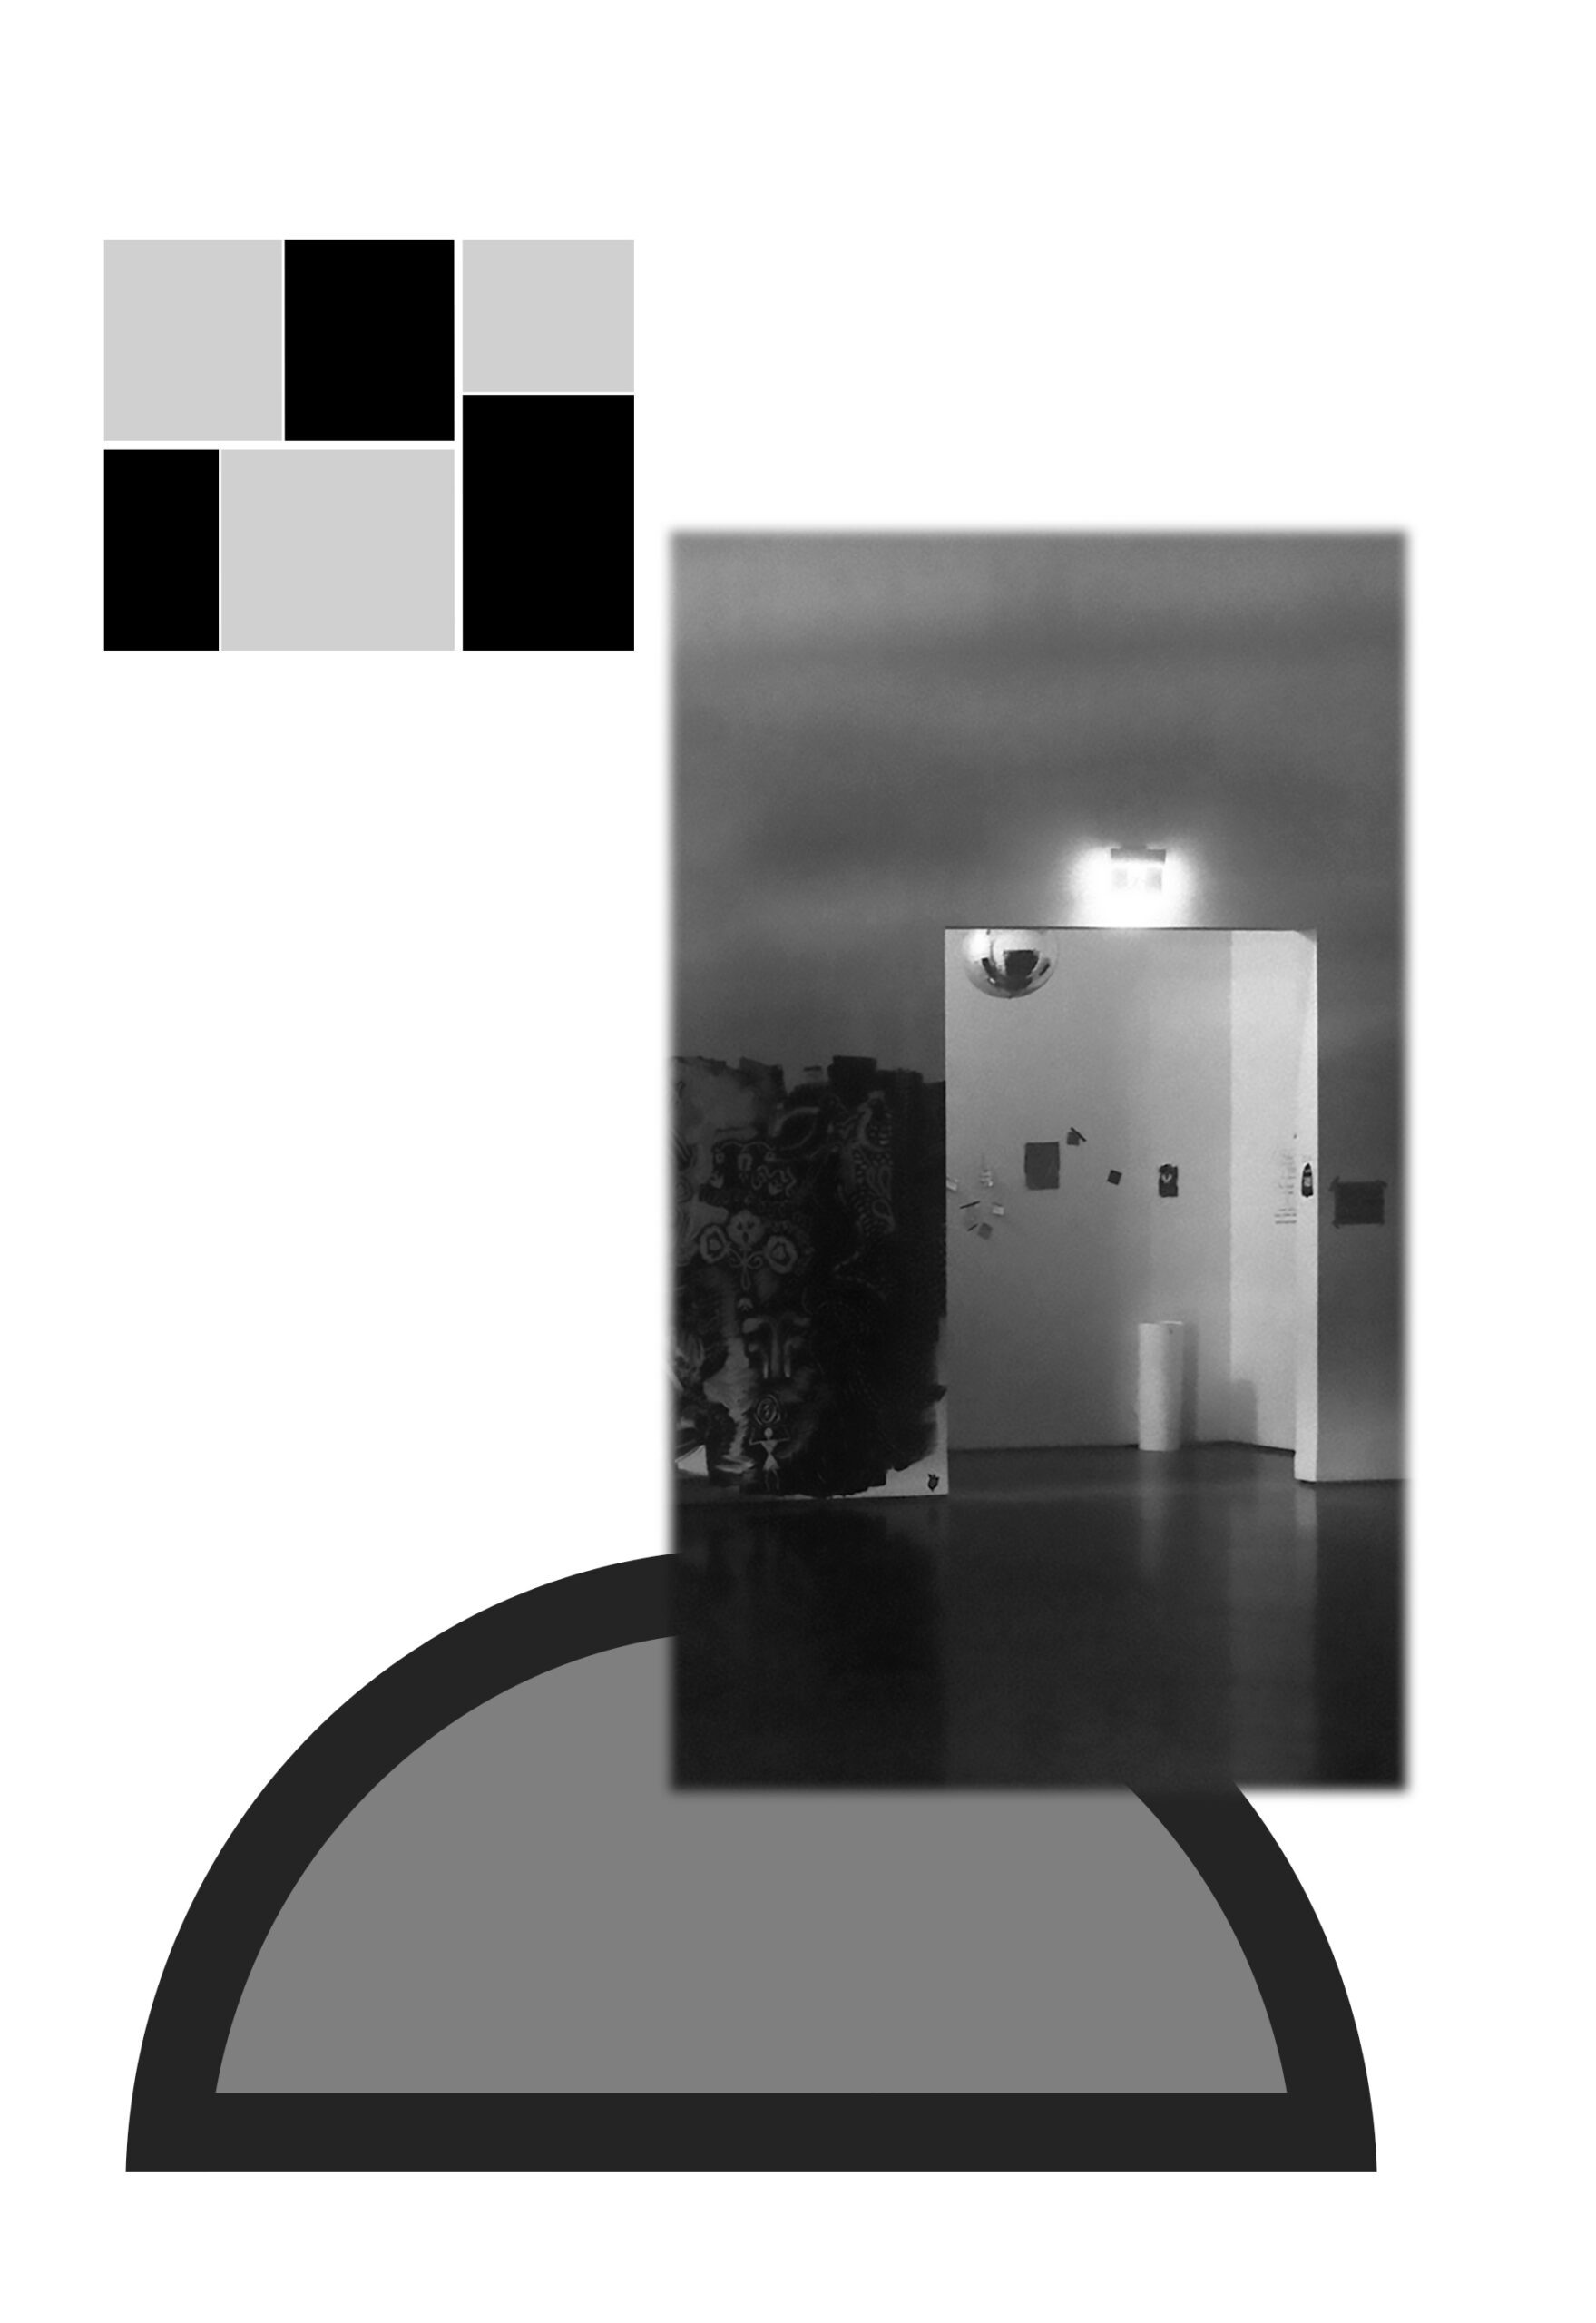
Gallery View 3. Tree map of 2020 spending on post-secondary education in Canada (top left), the USA (right), and Mexico (lower left); each rectangle representing the percentage of funding from private (black) or public (light grey) sources. Adapted from OECD Data.
A series of images created in 2022–2024 for an Emily Carr Faculty exhibition and publication.